
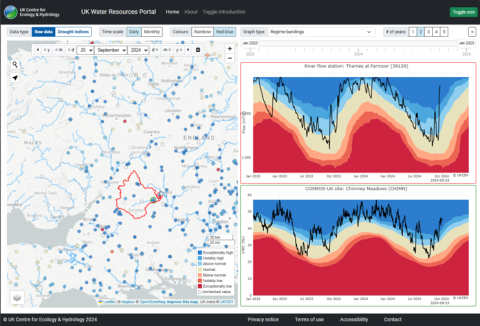
The UK Water Resources Portal is a unique web-based system for tracking the hydrological situation in near-real-time. It offers dynamic, interactive situation monitoring, mapping and plotting and a wide range of variables including rainfall, river flow, groundwater levels and soil moisture measurements (from COSMOS-UK). Near real-time river flows across England are fed in from the Environment Agency hydrological data service and Scotland from the new SEPA Time Series Data Service.
The portal is aimed at anyone with an interest in current water resources situation or drought conditions. The primary focus is for water resources and drought applications, but it can also be useful for tracking river flows and soil moisture in real time in order to provide an indication about high flows, as well as low flows.
The portal collates data from a variety of sources, including the national measuring authorities for river flows and groundwater levels: the Environment Agency (for England), the Scottish Environment Protection Agency, Natural Resources Wales and the Department for Infrastructure - Rivers in Northern Ireland. A help video, below, takes you through its features.
Access the UK Water Resources Portal (now at ukwrp.ceh.ac.uk)
The portal provides access to the following datasets;
- Rainfall from the Met Office (gridded, and over gauged catchments and hydrometric areas)
- River flows from the National River Flow Archive (for historical data) and the Environment Agency and the Scottish Environment Protection Agency (for real-time data)
- Groundwater levels from the relevant national measuring authority, delivered in collaboration with the British Geological Survey
- Soil moisture (from UKCEH’s COSMOS-UK network)
As well as visualizing observed and measured data, it can also be presented as ‘standardised indices’ which show the anomalies from the long-term average. The information can also be viewed on layered maps, including the UKCEH Land Cover Map 2015 and the BGS Hydrogeology 625K, which, respectively, show the type of land use and geology across the UK on a 1km scale.