The rating plots shown for peak flow stations on the NRFA website have been updated to be interactive.
New features allow you to choose to show the ratings and gaugings that relate to the time period chosen using the slider. You can also use the zoom and pan tools to explore the plot, for example you may want to get a better view of the gaugings where there is a cluster. Hovering over ratings will give information about the limb, whilst hovering over gaugings gives the date, stage and flow. You can also download an image of the rating plot.
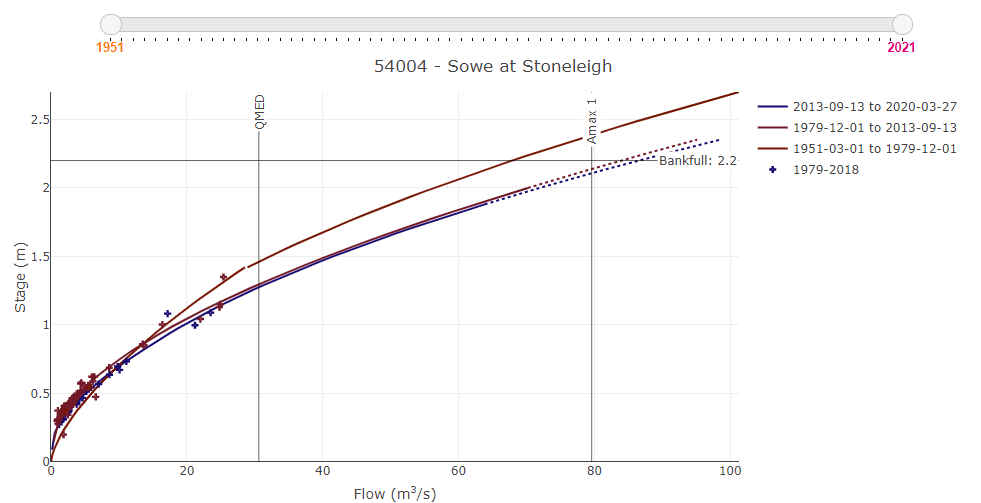
Where available the rating plots will also show AMAX1, QMED and the bankfull stage.
View the interactive rating plot by visiting a peak flow page (e.g. 54004) and choose 'Peak flow rating information' in the Data type drop down menu.
The static plots are still available on the website, just click the tab above the rating plot. Users should be aware that the stage-discharge equations applied to the peak flow data are not always the same as those applied in the main hydrometric Measuring Authority archives and those used to calculate the NRFA daily flow data.
More information about ratings on the archive.