The UK Water Resources Portal has been updated with new indicators to give users a broader view of dry weather and its effects across the UK. The additions bring together information on climatic water balance and vegetation condition and health, helping users explore how drought develops and impacts the landscape. 

What is the UK Water Resources Portal? 

An interactive online tool that brings together near-real-time and historical information on rainfall, river flows, groundwater, soil moisture and drought indicators. It allows users to explore and compare water resources conditions across the UK through accessible maps, plots and data. 
Explore the UK Water Resources Portal.

By viewing these new indicators alongside river flows, groundwater levels, soil moisture and other datasets already available in the Portal, users can build a more complete picture of current and past water resources conditions. The updates support researchers, water managers and anyone interested in understanding drought and water availability across the UK. 
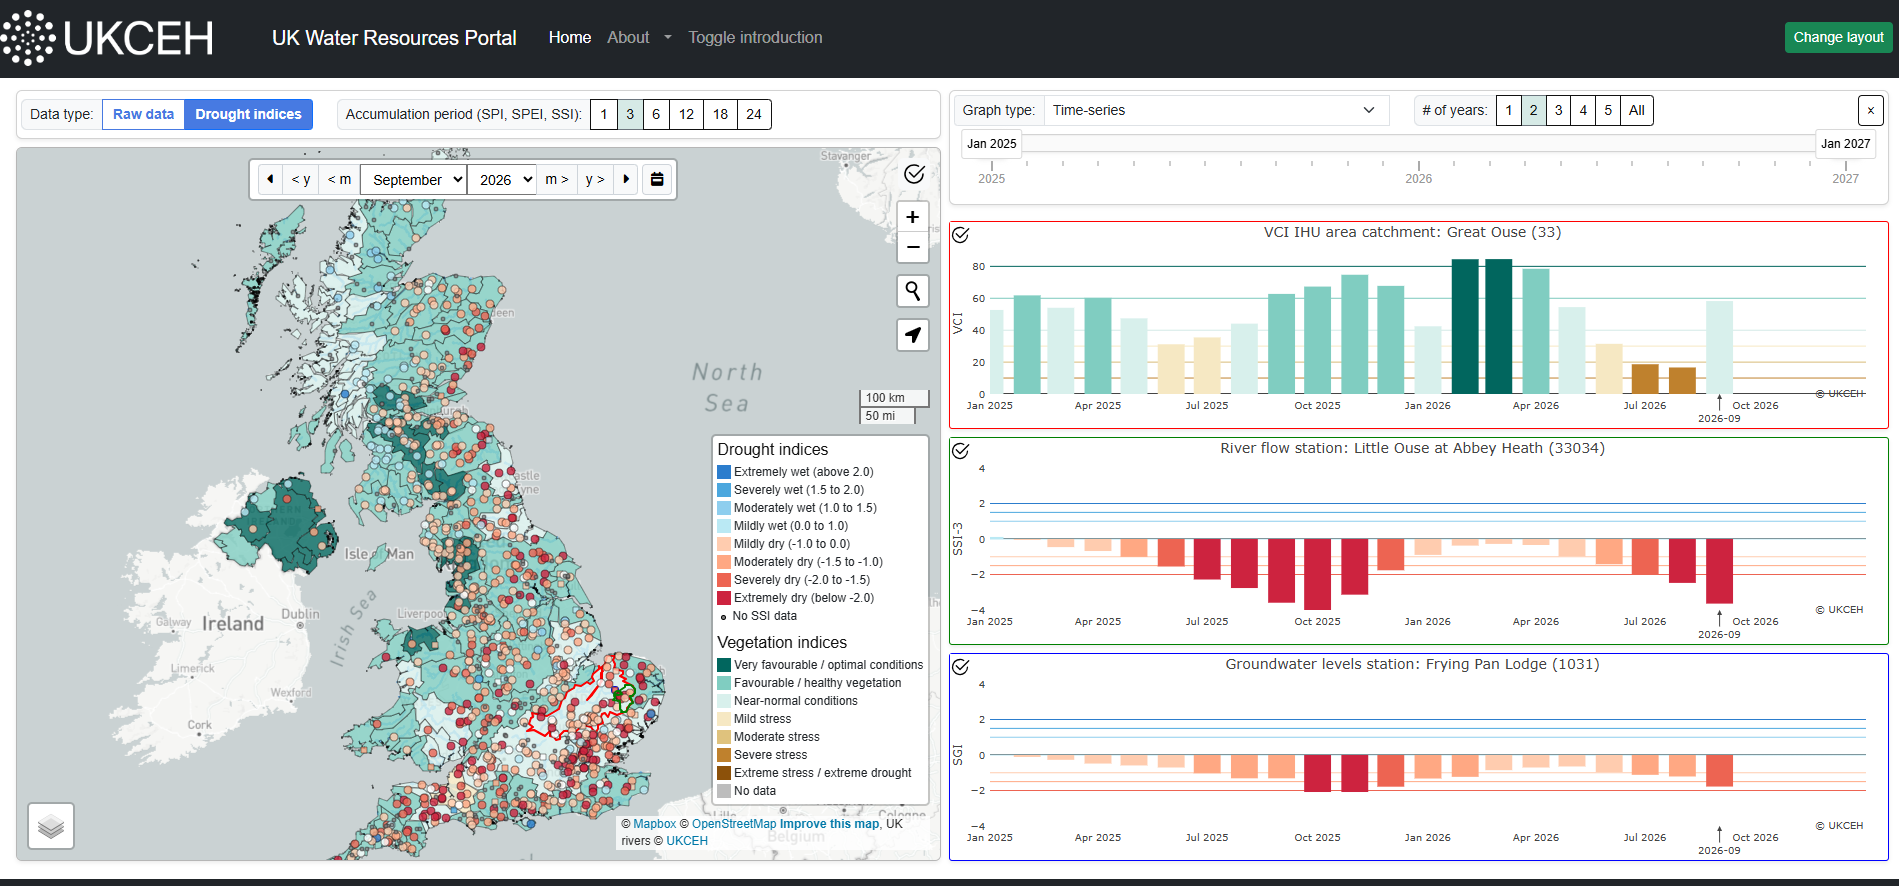
Screenshot of updated UK Water Resources Portal

Screenshot of the updated UK Water Resources Portal showing the Vegetation Condition Index, the Standardised Streamflow Index and the Standardised Groundwater Index for September 2026.

Standardised Precipitation Evapotranspiration Index (SPEI)

A new addition to the Portal is the Standardised Precipitation Evapotranspiration Index (SPEI). Like the Standardised Precipitation Index (SPI), the SPEI shows whether conditions are wetter or drier than usual over different timescales. However, it also accounts for potential evapotranspiration — the loss of water to the atmosphere from soil, plants and open water — characterising the ‘climatic water balance’. This makes it particularly useful for monitoring drought when low rainfall occurs alongside unusually high temperatures that intensify the dry conditions, as experienced in 2025 and 2026. By including the additional drying effect of heat, SPEI can show the severity and development of these conditions more clearly than a rainfall-only indicator.

September 2026 SPEI Maps

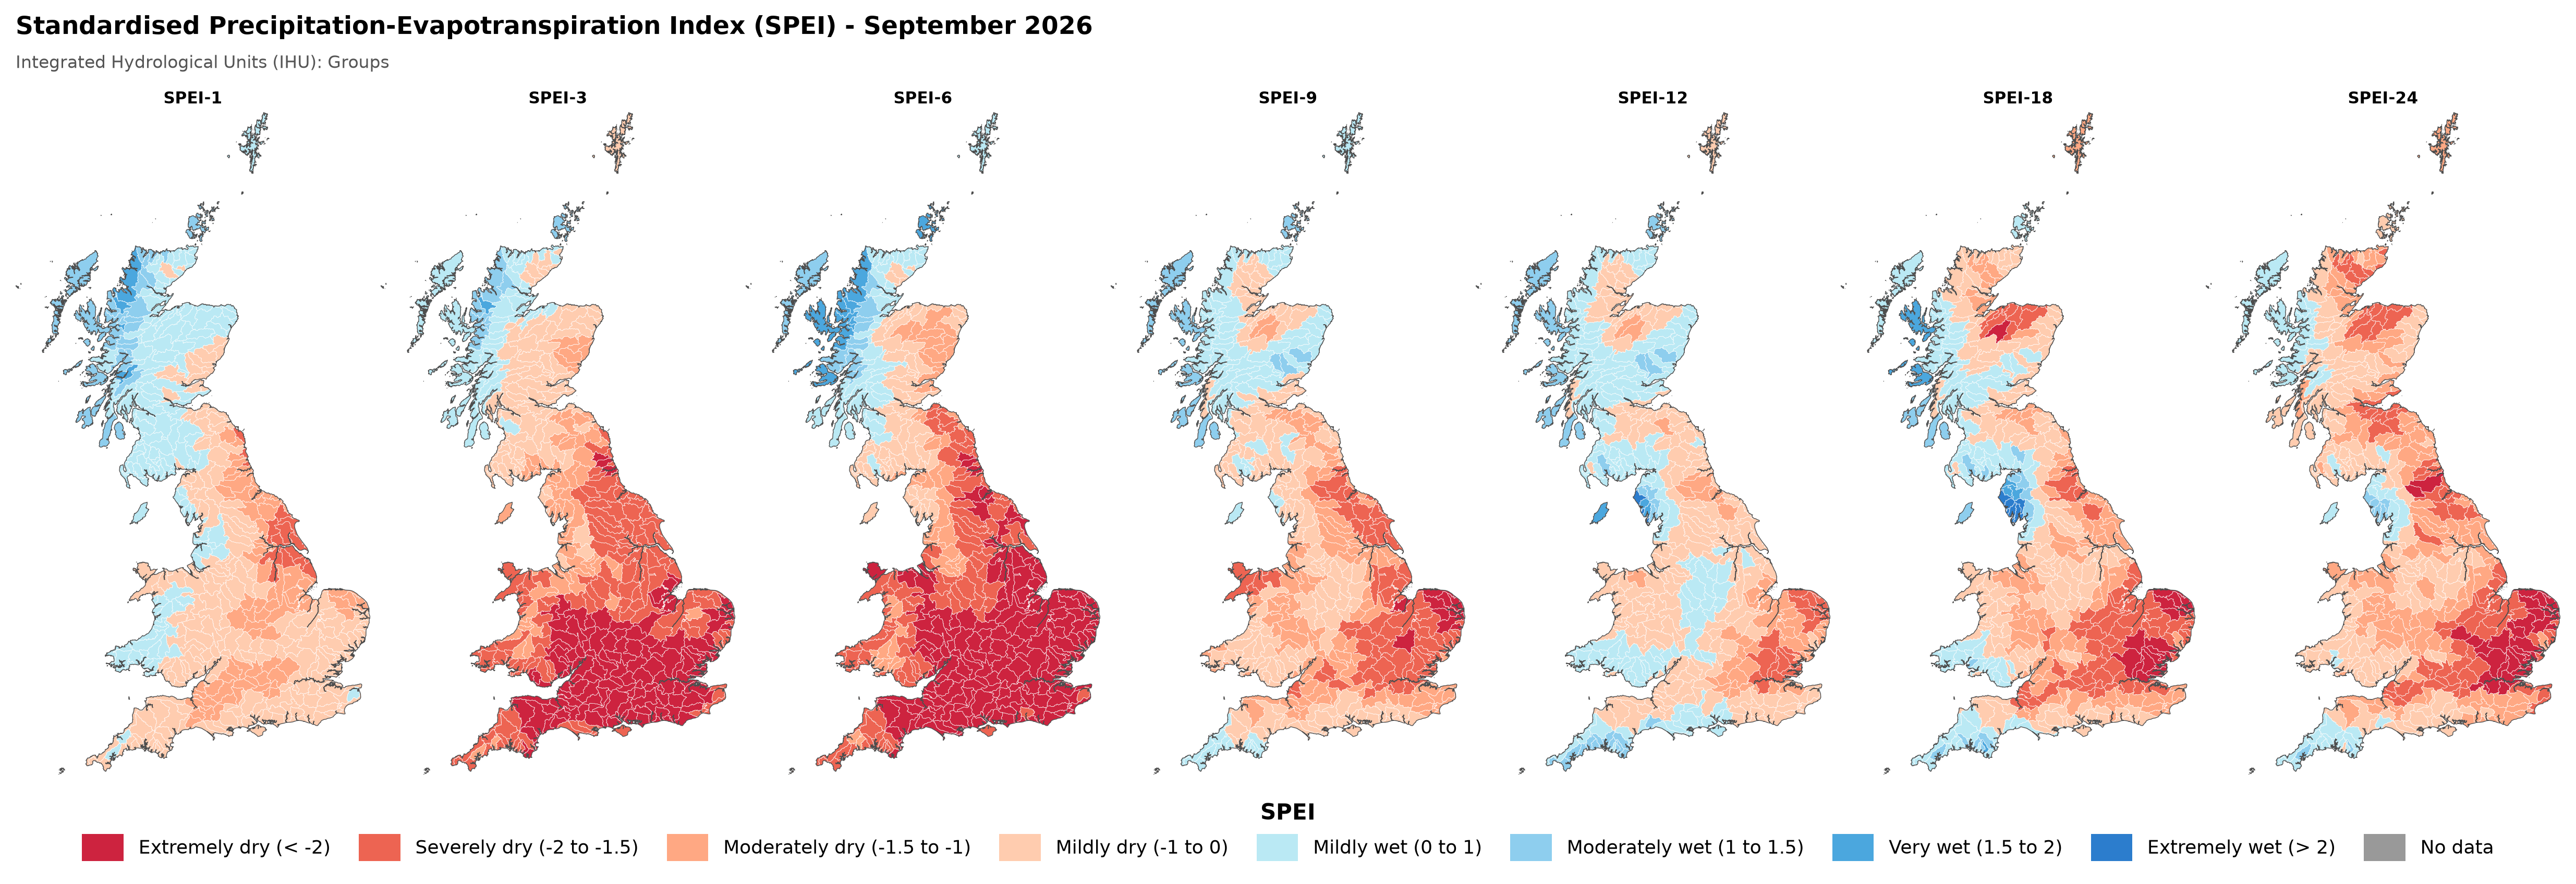
September 2026 Standardised Precipitation Evapotranspiration Index (SPEI) for various accumulation periods. 1km gridded data has been aggregated to basin scale for Integrated Hydrological Units (groups) across Great Britain.


These maps show the SPEI for September for different accumulation periods, which shows the climatic water balance over different durations. For example, the SPEI-3 shows the climatic water balance for the last three months ending in September (i.e., from July to September), whilst the SPEI-12 shows the balance over the last year (i.e., October 2025 to September 2026). It’s interesting to see that, despite the very wet winter, in the longer 12- and 24-month accumulation periods, we still see extensive deficits and extremely dry conditions across much of East Anglia.  

The SPI and SPEI data have been derived from the latest version of the HadUK-Grid monthly dataset up to 2025 (currently version 1.3.2.ceda, Met Office et al., 2018), data from 2026 use provisional HadUK data supplied by the Met Office to UKCEH under an Open Government License. 

Vegetation indices

The Portal now also includes three satellite-based vegetation indicators, which can help users identify where plants may be experiencing stress and users can compare patterns across the country:

  • The Vegetation Condition Index (VCI) shows how green vegetation is compared with the range previously observed at the same location and time of year.  
  • The Temperature Condition Index (TCI) highlights unusual land-surface temperatures, which can indicate heat stress.  
  • VCI and TCI are combined in the Vegetation Health Index (VHI), providing an overall picture of vegetation condition. 


March to August 2026 VHI maps

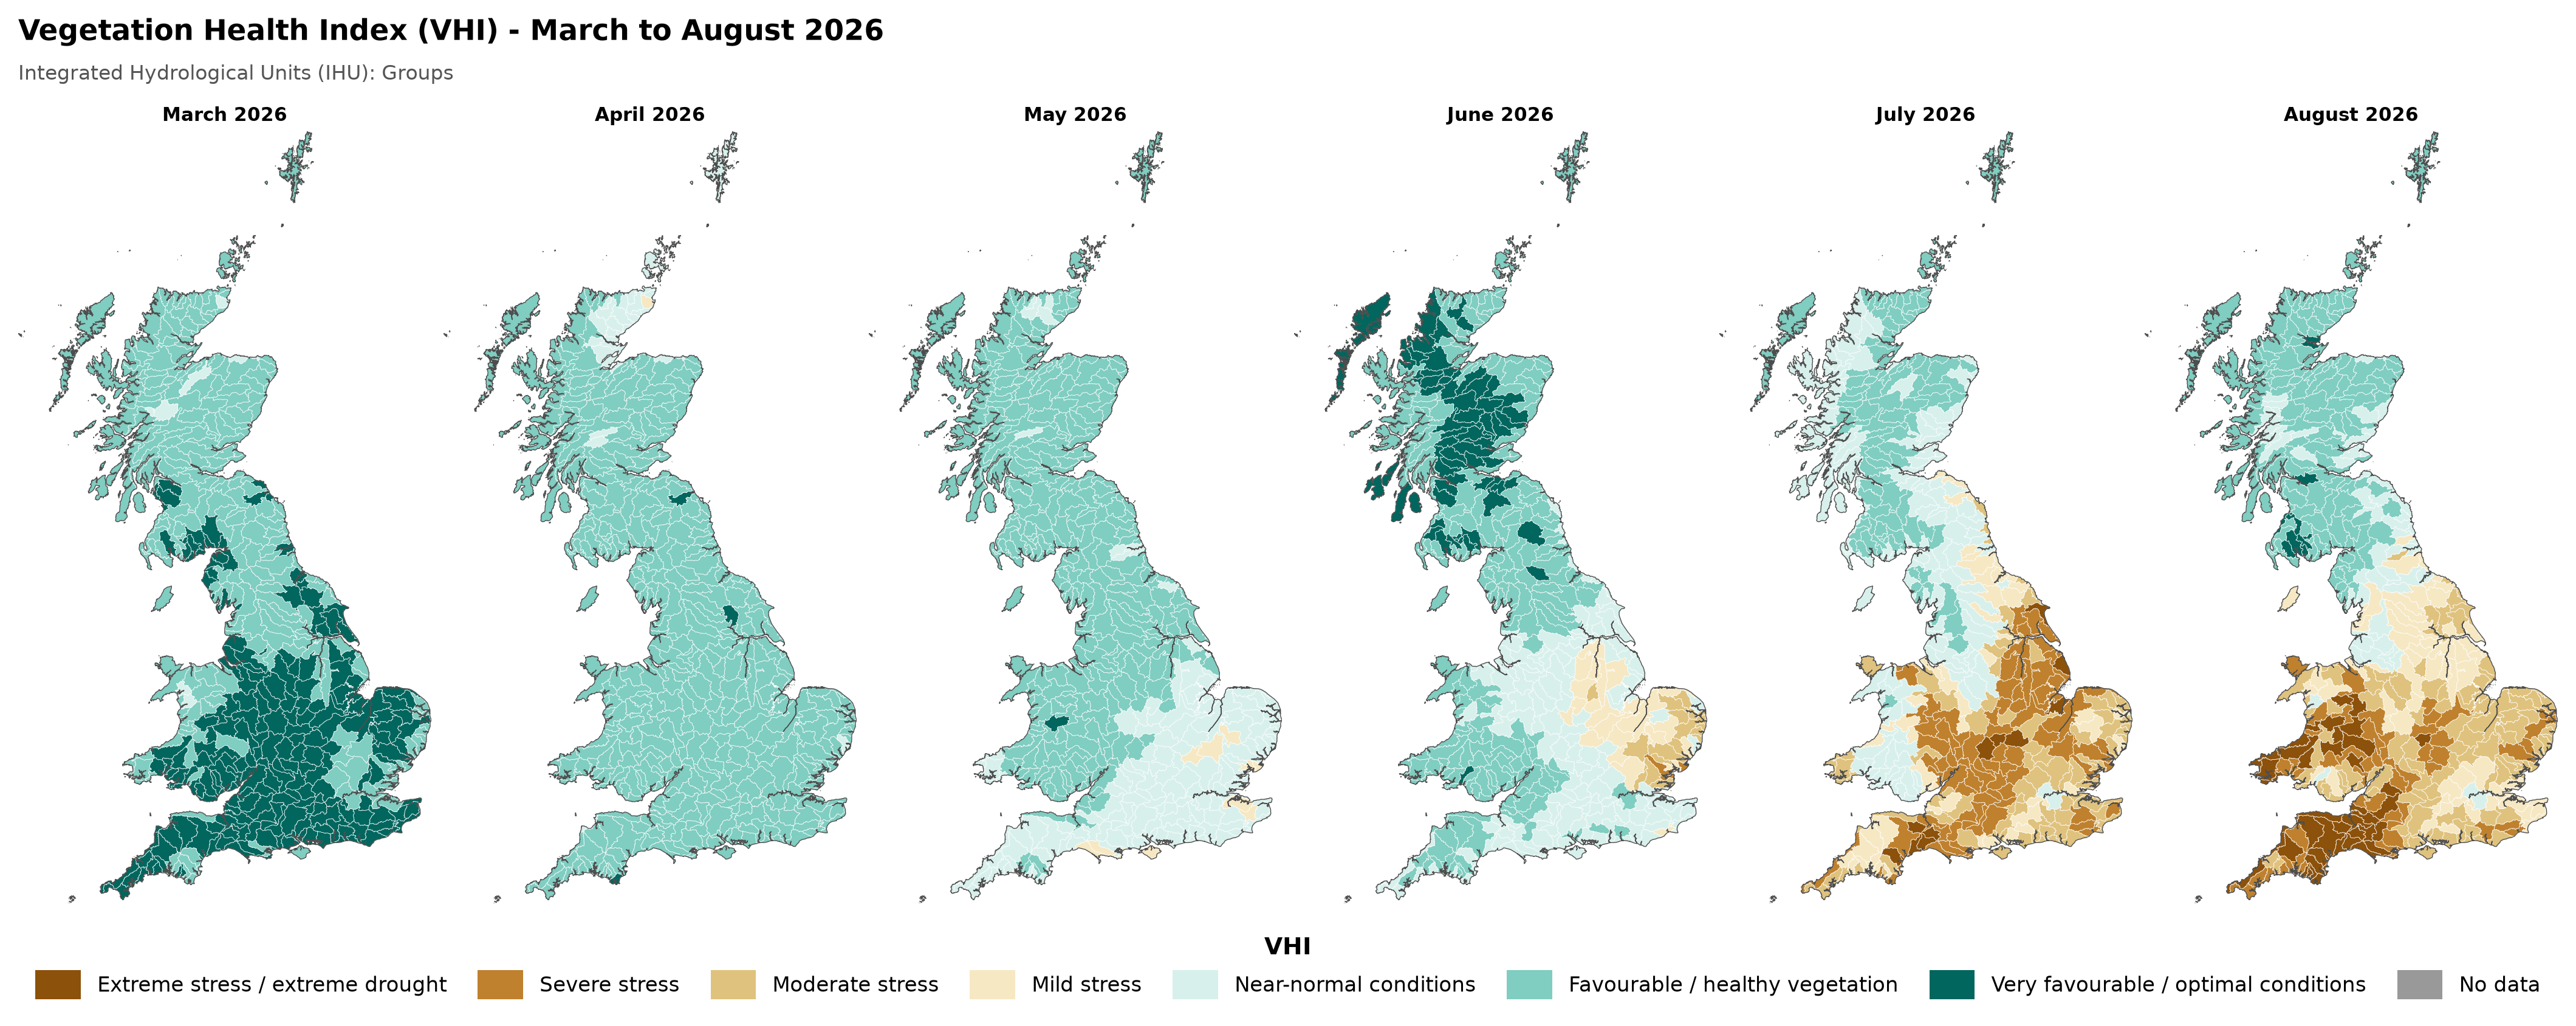
March to August 2026 Vegetation Health Index. 1km gridded data has been aggregated to basin scale for Integrated Hydrological Units (groups) across Great Britain.
 

These maps show one of the new vegetation indices added to the Portal – the Vegetation Health Index (VHI), shown here between March and August 2026. The maps show how vegetation health declined across Great Britain over the summer, especially in Wales and south-west England. These vegetation indices have been derived from MODIS earth observation data.

We will be making the drought and vegetation indicator datasets up to 2025 available in the final quarter of 2026 via the Environmental Information Data Centre. Data for individual catchments, basins or grid cells can be downloaded from the UK Water Resources Portal. 

These updates have been supported by funding from the Natural Environment Research Council (NERC) as part of the National Capability for UK Challenges (NC-UK) programme and the Indicators to Impacts for drought Surveillance (IRIS) project; and the Co-Centre for Climate + Biodiversity + Water.  

Find out more

More information on the drought and vegetation indices shown on the UK Water Resources Portal can be found on the Drought indices about page.

Read about the development of the UK Water Resources Portal in the open access paper ‘Dynamic High Resolution Hydrological Status Monitoring in Real-Time: The UK Water Resources Portal’.